Access our weekly Norwegian salmon price index for transparent market benchmarking
- Tracks weekly Norwegian salmon prices and traded export volumes (HOG)
- Combines SISALMONI and NQSALMON indices for complete historical price continuity
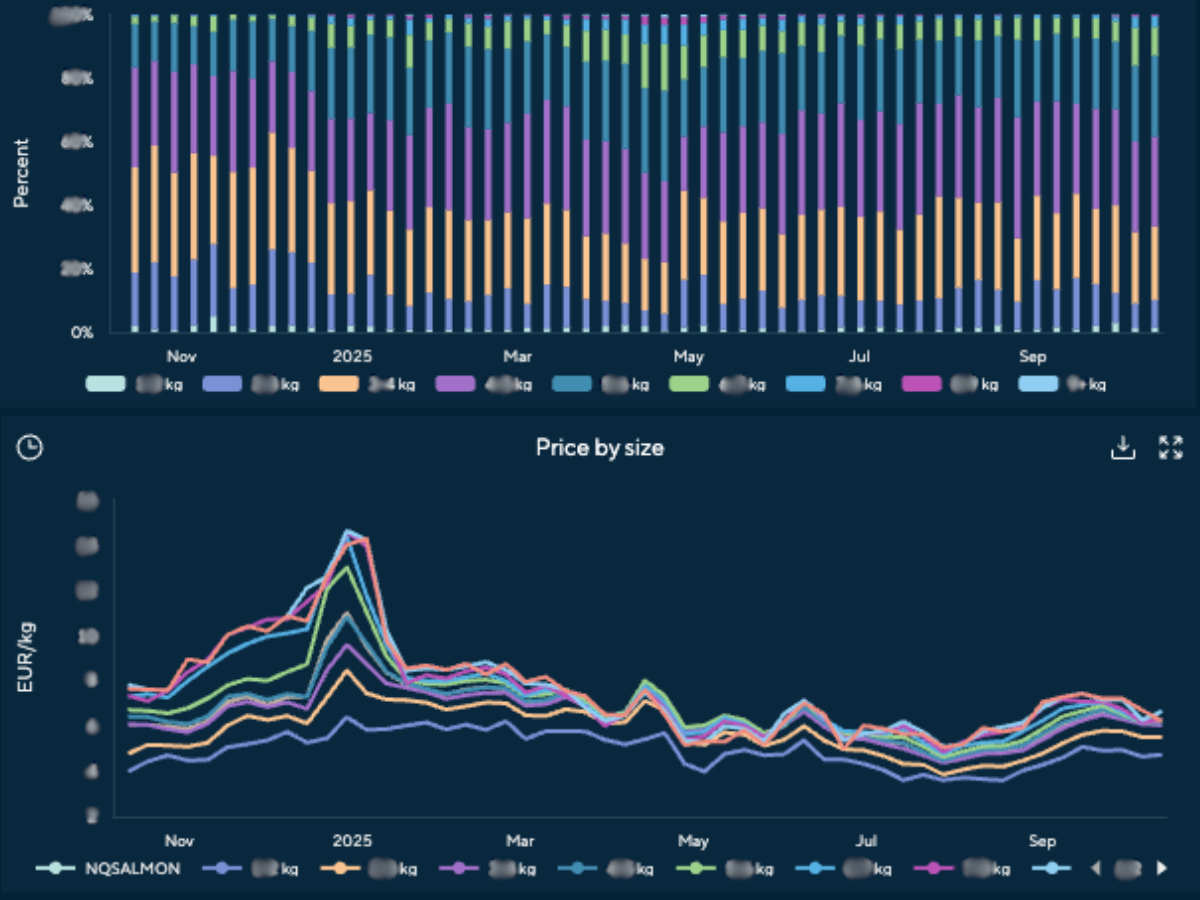
- Displays price movements by weight category to identify market composition trends
- Based on verified exporter data for transparent and standardised reporting
- Updated weekly (Tuesday 15:00 CET) with comparable week-on-week performance

What it offers
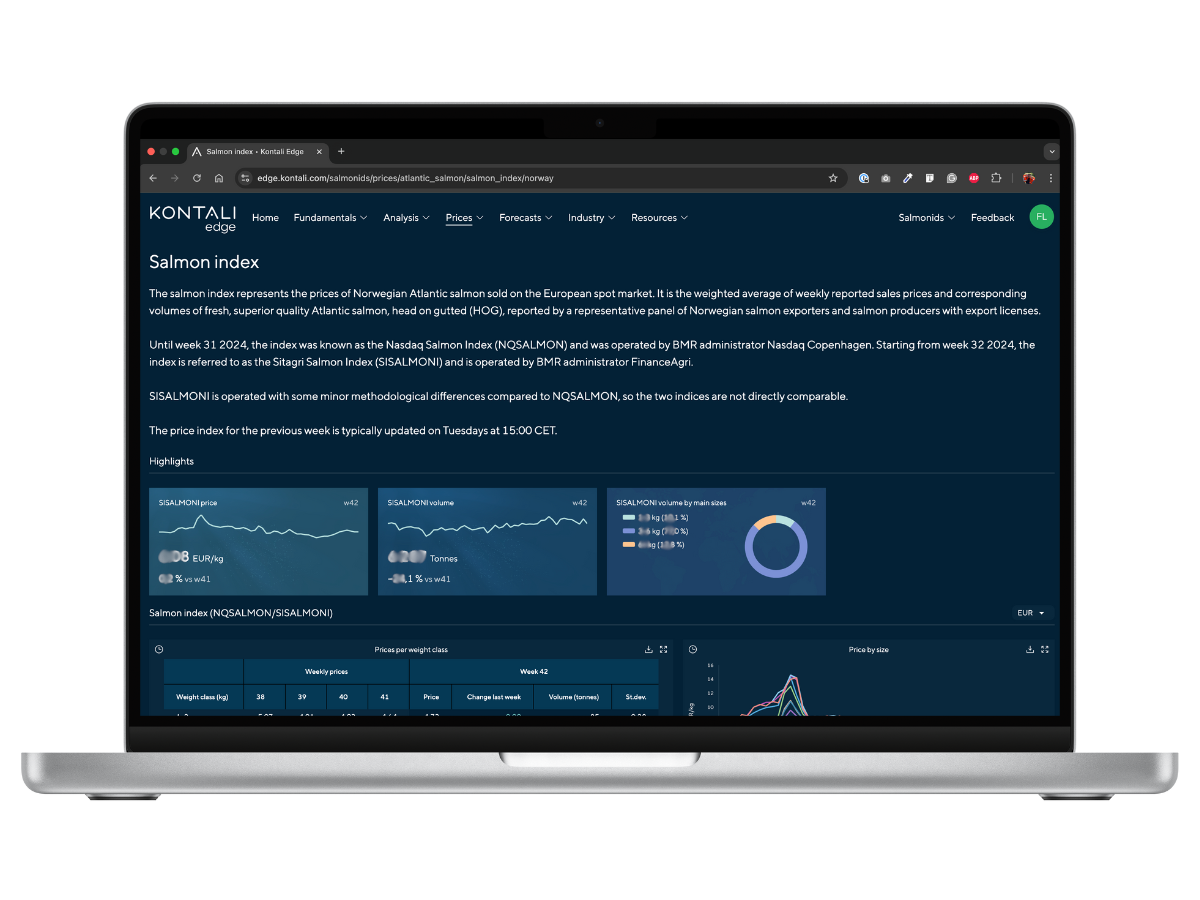
The Salmon Index provides a single benchmark for monitoring Norwegian salmon prices and export volumes traded each week. It allows users to track spot prices, analyse historical trends, and evaluate market developments through standardised and transparent reporting.

Why it matters
Transparent and frequent price reporting is vital for informed salmon market analysis. The Salmon Index provides consistent benchmark data to guide pricing strategies, contract adjustments, and financial modelling. It ensures continuity across market phases, supporting both short-term trading and long-term planning.

Who would benefit
Designed for salmon producers, exporters, traders, analysts, and investors who require precise weekly market benchmarks. Perfect for teams managing pricing, procurement, or investment decisions in the global salmon industry.

Our methodology
The Salmon Index is built on weekly reported export prices and volumes of Norwegian Atlantic salmon (HOG) from a verified exporter panel. Data accuracy is maintained through standardised collection and consistent weighting. The index transitioned from NQSALMON (Nasdaq Copenhagen) to SISALMONI (FinanceAgri) in August 2024, while keeping the same benchmarking principles. Prices are shown per weight class in EUR/kg, with indicators reflecting weekly changes.
Experience it yourself
Get started today. Request a demo or ask any questions you may have. Once our customer service team has been informed, we will get back to you!
Accept marketing cookies to load the form
What replaced the Nasdaq Salmon Index (NQSALMON)?
The Sitagri Salmon Index (SISALMONI) replaced NQSALMON on 6 August 2024 and continues weekly reporting of Norwegian salmon prices.
Can I still access historical NQSALMON data?
Yes. Both NQSALMON and SISALMONI data are accessible in Kontali Edge, providing comprehensive historical trend tracking.
How often is the Salmon Index updated?
Every Tuesday at 15:00 CET, with comprehensive week-on-week comparisons.
Who provides the data for the Salmon Index?
Data come from a representative panel of Norwegian exporters and producers holding valid export licences.
Can the Salmon Index be used for pricing or valuation models?
Yes. The index is used by financial institutions, exporters, and producers as a market benchmark for pricing, valuation, and performance assessment.
How are SISALMONI and NQSALMON different?
Although both follow the same benchmarking principles, SISALMONI introduces minor methodological adjustments, so the two datasets are not directly comparable.